Service graphs
Graph Information
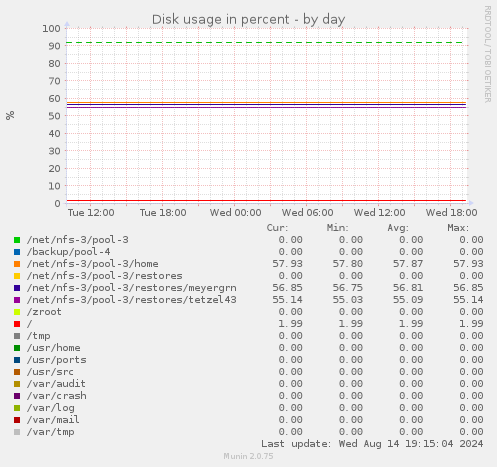
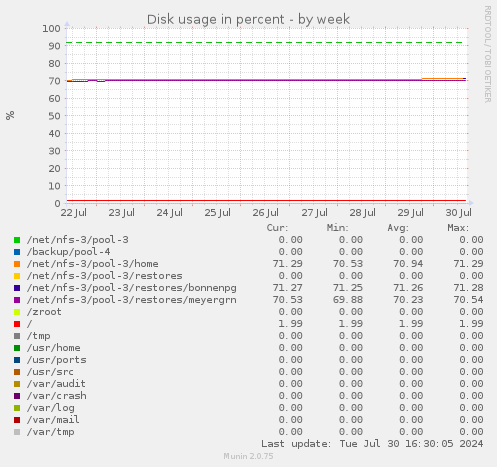
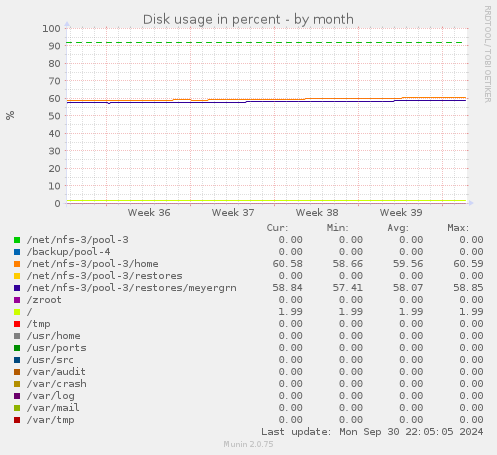
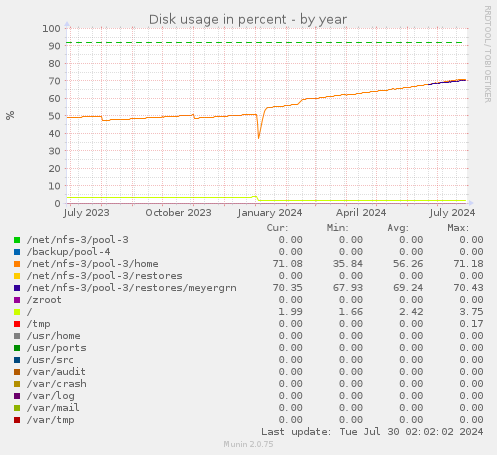
This graph shows disk usage on the machine.
| Field |
Internal name |
Type |
Warn |
Crit |
Info |
| /net/nfs-3/pool-3 |
pool_3 |
gauge |
92 |
98 |
|
| /backup/pool-4 |
pool_3_backup_pool_4 |
gauge |
92 |
98 |
|
| /backup/pool-4/home |
pool_3_backup_pool_4_home |
gauge |
92 |
98 |
|
| /net/nfs-3/pool-3/home |
pool_3_home |
gauge |
92 |
98 |
|
| /net/nfs-3/pool-3/restores |
pool_3_restores |
gauge |
92 |
98 |
|
| /zroot |
zroot |
gauge |
92 |
98 |
|
| / |
zroot_ROOT_default |
gauge |
92 |
98 |
|
| /tmp |
zroot_tmp |
gauge |
92 |
98 |
|
| /usr/home |
zroot_usr_home |
gauge |
92 |
98 |
|
| /usr/ports |
zroot_usr_ports |
gauge |
92 |
98 |
|
| /usr/src |
zroot_usr_src |
gauge |
92 |
98 |
|
| /var/audit |
zroot_var_audit |
gauge |
92 |
98 |
|
| /var/crash |
zroot_var_crash |
gauge |
92 |
98 |
|
| /var/log |
zroot_var_log |
gauge |
92 |
98 |
|
| /var/mail |
zroot_var_mail |
gauge |
92 |
98 |
|
| /var/tmp |
zroot_var_tmp |
gauge |
92 |
98 |
|